Network Analysis and Routing for
Frac Sand Mines and Railroad Terminals
Introduction
The process of network analysis is a vital tool for
analyzing most effective routing and for
potential cost assessment for a variety of different levels from city to state.
When coupled with python scripting and data flow modeling, the possibilities
for customization of search criteria and the end usability of the resulting
data far surpasses the time required to initially develop the models. In this
exercise, we started by developing scripts to eliminate extraneous data from
our datasets. We then learned about the functions of the Network Analysis
toolbox in ArcMap. Our final step was to develop a data flow model that
automated the processes after our python scripting. The resulting output
provided the comprehensive length of routes for each county and the cost of
travel for trucks on those roads.
Methods
Python Scripting
A python script was written in the first half of this
exercise that selected active mines that were not rail loading stations. To
account for any mines that may have been rail loading stations as well, a 1.5
kilometer zone around the railways was eliminated from the search criteria.
More details concerning the scripting process and a screenshot of the script
can be seen under the “Python Scripts” tab found at the top of this page.
Network Analyst
Network Analyst is a toolbox within the ArcGIS Suite that
allows for advanced route modeling, among other things. Using Network Analyst,
we were able to assess the fastest routing available for sand trucks traveling
from the sand mines to the rail loading terminals. The network dataset used for
the roadway mapping was acquired from ESRI Street Map data for the United
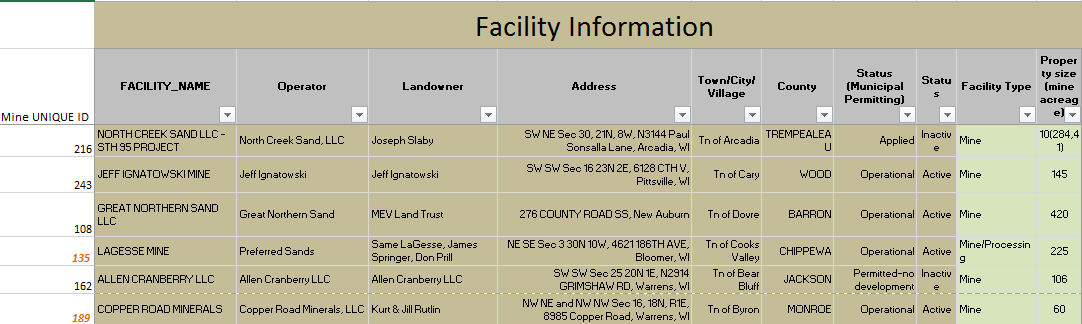
States. The mine location data was
acquired from the Wisconsin DNR. The rail terminal data was acquired from the
Department of Transportation website. In order to determine travel distance and
cost of travel we first had to determine a closest facility that each truck
would be traveling to where they could offload their sand. These routing
options were tested by manually inputting the facilities (rail terminals) and
the incidents (mines). The objective of this lab was to fully automate the
process where a useable model could be easily used again by implementing new
base layers and rerunning the data flow model.
Data Flow Model
A data flow model was created that automated the work
required for replicating the results for new datasets, if needed. Figure 1
shows the complete data flow model for this exercise. A majority of the data
flow model was quite simple to compile. In order to create the routing for the
sand trucks from the mines to the rail terminals a closest facility was
determined for each mine, locations were added that determined the input
functions for where the trucks were being routed to, and the data was solved,
all using simple tools within the Network Analyst toolbox. Following this, the
data was selected, the features were copied, and an output feature class was
created that saved the temporary feature class created by the previous solve
function. Finally, the data was
projected in a Wisconsin (meter) projection that allowed it to be compatible
with the rest of the data. However, when following the model, after the green
circle called “Results_Prj,” the methods involved were somewhat more difficult.
.jpg) |
| Figure 1. This data flow model shows the process needed to complete the entire process described in the methods section. |
A number of steps were required in order to convert the
route data to a useable feature on the county level, which allowed us to
calculate comprehensive distance traveled and cost of travel for each county.
There were a number of different methods to accomplish this, but I started mine
using the intersect tool. Intersecting allowed me to split the route line
feature class by the polygon boundary. After this, I used a spatial join to
combine the feature class for Wisconsin counties by the intersected route data.
This prepared the data to be summarized by county, rather than just overall
route length. When summarizing the comprehensive route length I used the
Summarize Statistics tool, summarizing the length by county designation. After
this, I was able to use the add field tool to add a field showing the distance
in meters converted to distance in miles. I used the Calculate Field tool to
create an SQL statement to calculate the comprehensive lengths multiplied by
the conversion factor for one meter to one mile (0.00062137). Finally, another
field was added and a value was calculated for the cost of travel for a trip by
a truck to and from a rail terminal, estimating the cost of fuel per mile at
$2.20.
Results
It should be noted that all of the data in the following
section is hypothetical and in no way
calculates usable results other than those determined for the sole purpose of
this lab. Figure 2 shows the resulting map created after running the data flow
model.
 |
| Figure 2. This map shows the results of the data flow model after the routes have been created. |
Figure 3 shows the resulting attribute table created after running the
data flow model. Figures 4 and 5 are choropleth maps that denote the counties
with the highest travel distance and counties with the highest cost associated
with travel. It makes sense that Chippewa County, the county that travels the
greatest distance (approximately 205.77 miles) would pay the most per year in
fuel ($45,269.70), as this would constitute a direct relationship. As distance
traveled increases the cost will increase in a direct fashion. Burnett travels the least of the sixteen counties included (1.28 miles), and
therefore pays the least ($280.56).
 |
| Figure 3. This table shows the data after the final statistics have been calculated. |
 |
| Figure 4. This map shows the total distance per year by county for frac sand transport routes. |
 |
| Figure 5. This map shows the total cost per year by county for frac sand transport routes. |
Figure 6 is a graph showing the total cost compared to the total distance traveled. Figure 7 is a small subset of Figure 6, shows the congested data that exists below one thousand miles traveled.
 |
| Figure 6. This graph shows the total cost per year vs. the total distance per year for each county included in the analysis. |
 |
| Figure 7. This graph is the same as the graph in Figure 6, however it only examines the total distance under fifty miles. This shows a number of the counties in a way that is readable. |
Discussion
There are much wider implications for county level analysis
of the data determined in this exercise. Accelerated deterioration of the
roadways caused by greater usage of the roads raises interesting questions
asking who should be taking on the brunt of road repair costs. Should mines
have to contribute a greater amount of money to county or city funded roads
because they use them to a greater extent then a normal citizen? From personal
experience I know that logging companies will pay for the repairing of roads
because they use them to a substantial degree and the loggers need them
maintained to a certain degree to ensure that transportation is streamlined.
Should frac sand mines be called upon to support the repair of roadways and
railways that are stressed as a result of a transportation-heavy industry? Is
there a better way to transport these resources from place to place? Currently,
I do not believe there is. When transporting extracted resources such as coal,
iron ore, timber, and sand there are really no other logistically feasible ways
to transport the raw materials, other than simply by truck and train. Should
the railway be expanded with more nodes closer to the location of the sand
mines, or even directly on site? That could be helpful, as it would reduce the
amount of stress placed on the roads, but it would most likely have an adverse
affect on the surrounding environment, as large swaths of trees would have to
be created to make this efficient and connect all the railways.
Conclusion
The logistics behind transporting frac sand from the
extraction sites to the distribution rail terminals poses a number of questions
that must be further assessed before determining a final result. In the
counties where frac sand companies place a large amount of stress on the
railways, an agreement must be reached between the company and the county on
what will be done to properly ensure the quality and safety of the roads and
rails for all users, whether that be the mining industry or civilians. Network
analysis and routing can assist in determining the most efficient way of
accomplishing this, while allowing for usage parameters to be set. Creating a
data flow model allows the workflow to be replicated as new data becomes
available and current data is updated. Using these techniques, the ability to
assess cost associated with frac sand transportation is much more accessible to
a wider audience.