Monday, October 20, 2014

GIS II: Data Acquisition

Exercise 5: Data Downloading, Interoperability, and Working with Projections in Python

Goal: 
The purpose of this lab was to become familiar with a number of different things. We were to become familiar with the acquisition of data from a multitude of sources. In this lab we acquired data from the USGS, NRCS, USDA, and Trempealeau County. After all of our data was acquired we had to know how to join the necessary tables so that the data was more usable. Then we had to understand how to write a Python code that allow us to project, clip, and load all of the data into the Trempealeau County geodatabase. All of this will continue to build upon the groundwork laid in Exercise 1, as we now have much of the data necessary to begin our analysis on Frac Sand Mining in Trempealeau County in West-Central Wisconsin.

Methods:
Our first step was to acquire the data necessary to begin our analysis. We downloaded data from the US Department of Transportation for railroad lines, from the USGS National Map Viewer for national land cover data and elevation data, from the USDA Geospatial Gateway for cropland data for the state of Wisconsin, from Trempealeau County for their most current working county geodatabase, and finally from the NRCS to download SSURGO data that had the county soil data. The SSURGO data needed to be joined with a number of other tables to ensure that it had all the data necessary to be beneficial and understandable for our project. In order to accomplish this, a SSURGO database was first brought into Microsoft Access A component table was imported from the downloaded soils geodatabase. The data was assigned the necessary parameters and then it was brought into ArcMap. In ArcMap we are able to conduct the necessary joins that bring this data together into one usable feature. Drainage Index and Productivity Index tables were acquired from the SSURGO website and brought into the soils feature as well. The last step for this first section of the project was to bring in the railroad feature class and clip it to the Trempealeau County boundary.

This next portion of the project was write a script to project, clip, and load all of the data acquired previously into the Trempealeau County Geodatabase. The workflow for this script has been provided in my blog "GIS II: Python Scripting." Figures 1, 2, and 3 are maps derived from the scripting.

Figure 1: This map shows the Digital Elevation Model (DEM) clipped to fit the Trempealeau County boundary.

Figure 2: This map shows the National Land Cover Data (NLCD) Land Use Designations clipped to fit the Trempealeau County boundary.

Figure 3: This map shows the National Agricultural Statistics Survey (NASS) Cropland Designation clipped to fit the Trempealeau County boundary.

A large component of this lab was to better understand interoperability and data accuracy. Below is a table (Table 1) that highlights what was able to be determined to assist in explaining the accuracy of the data. Some of the numbers were determined based on scale, however the rest was searched for in the provided metadata. If nothing was found for the particular cell then the designation "none" was used.

Table 1: This table shows what data was able to be acquire or derived from pre-existing metadata.
Conclusion:
This was a very frustrating lab. However, that I feel was a large objective of this exercise. Unfortunately, data is not available in a perfect, usable format every time. Data from different organizations, with different parameters, and with missing information are very common to come across when attempting to acquire data. The ability to understand the layout of this data, the integrity of the data, and the ways to make the data fit the needs of the project are very necessary skills.

Sites for Data Acquisition:
The data for this exercise was acquired from the following websites:
USGS National Map Viewer: http://nationalmap.gov/viewers.html
USGS National Agricultural Statistics Survey: http://datagateway.nrcs.usda.gov/
Trempealeau County: http://www.tremplocounty.com/landrecords/
NRCS Soil Survey: http://websoilsurvey.sc.egov.usda.gov/App/HomePage.htm

Wednesday, October 1, 2014

GIS II: Sand Mining in Western Wisconsin

Background on the Practice of Frac Sand Mining in Western Wisconsin

Introduction
     The practice of frac sand mining has been the cause of much discussion over the last few years, in western Wisconsin. However, to be able to speak on the topic, one must ensure that they are informed and understand what frac sand mining and hydraulic fracturing really is. In order to do that, there are a number of sources and sites that one can seek out to educate themselves on the topic, a number of which I have listed at the end of this post. In this post, I will begin from a regional scale, in this case the western portion of Wisconsin, and move to a national view, to attempt to highlight both frac sand mining and hydraulic "fracking," and in doing so, bridge the gap between what happens in our own backyard and what happens once the sand leaves it.

What is frac sand mining?
Figure 1: Size of the individual frac sand grains in relation to
the size of a penny (Marcotty 2012).
     Frac Sand Mining is the process of extracting silica sand, or silicon dioxide (quartz) from the ground (WDNR 2012). Generally this is accomplished through the excavation of open pit mines, procuring the sandstone, crushing it, washing it, sorting it, and storing it until it can be shipped. While this highlights the process, it does not necessarily describe what the mining company hopes to obtain and what they are looking for in the first place. To understand this, one must look at the product, itself. Not any kind of sandstone will do, either, as a specific kind of sand is required for fracking. This sand is generally found in the Cambrian aged Jordan, Wonewoc, and Mt. Simon formations, or in the Ordovician aged St. Peter formation (WDNR 2012). These formations are comprised dominantly of a very pure form of quartz. These quartz grains have to fit a number of criteria to meet the specific fracking job. This generally means that the grains need to be uniformly shaped, 0.2-0.8 mm in diameter (Figure 1), well rounded, and high in strength (Syverson 2012). This will ensure that the next step of the process, the actual fracturing process, will be successful.

     The mines can be range in varying degrees of size, from small operations of 100 acres to much larger operations of 1,500 acres. Much goes into the excavation and processing of the sand in order to change it into a usable product to mine shale gas, the natural gas being obtained from hydraulic fracking. A very useful site to better understand the process of frac sand mining is found on the Wisconsin Geological and Natural History Survey (http://wgnhs.uwex.edu/wisconsin-geology/frac-sand-mining/frac-sand-mining-process/). This site gives a ten-step breakdown of the process and provides aerial imagery and ground imagery to help in the description.

Figure 2: Map showing the growth of frac sand mines and
processing plants in Western Wisconsin (Prengaman 2012)
Frac Sand Mining in Wisconsin
     Frac sand mining in Wisconsin has taken on considerably over the last few years. Figure 2 illustrates the extent of the development of frac sand mining in western Wisconsin. It is quite apparent how much growth has occurred, as the number of "permitted, developing" sites is much greater, by visual analysis, than that of any other except "operating facilities." The graph in Figure 3 also helps to quantitatively illustrate the number of proposed, in-development, and current sand mines in operation, the most of which happen to be in Trempealeau County, the area of interest for our future studies in this course.


Figure 3: This line graph shows the data from the map, though allows for quantitative understanding. The number of proposed and in development sites are quite staggering compared to the number of sites already operational. (Prengaman 2012)

Figure 4: This map helps to show the location
of the railways in the state in relation to the
location of the frac sand mining and processing
facilities (Golden 2014).
     According to Kate Prengaman of the Wisconsin Center for Investigative Journalism, if the current trend continues, Wisconsin is on track to sell roughly 50,000,000 tons of sand per year (as estimated by the Department of Transportation). This equates to about 9,000 truckloads per day of sand moving to processing facilities. Where does all this sand go? It goes to railways, mostly, which then ship the sand to the necessary locations for the purchaser to begin the process of hydraulic fracturing. Many of these sand mines are located very near to railroad tracks in order to cut costs and reduce the overall expense on gas from transport trucks. Figure 4 helps to show the location of the railways in relation to the frac sand mines.

     There are a large number of different regions that will receive the sand once it is shipped for use in hydraulic fracturing. Figure 5 and Figure 6 help to show the many different regions that use the sand for fracking purposes, as well as where Wisconsin send its sand.
Figure 5: This map shows the locations of the various regions underlain by shale that is desirable for hydraulic fracturing. A booming region currently is the Marcellus Shale region, located in the Appalachian Basin. This is one of the largest shale gas deposits in the country. (EIA 2011).

Figure 6: This map shows the destination of Wisconsin frac sand in the United States. The Bakken Formation in North Dakota, Denver Basin Formation in Colorado, Eagle Ford and Barnett Formations in Texas, and Marcellus Formation in the Appalachian Basin are all included. (Chase and Golden 2014)

Hydraulic Fracturing: A Brief Overview
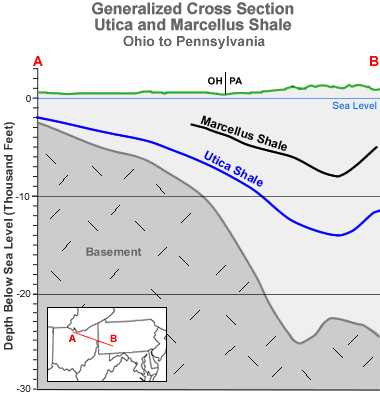
     The process of hydraulic fracturing is a very resource and work intensive process. For the purpose of providing an insight into the process in a general unit, we will examine the Marcellus Formation
Figure 7: Cross-Section of the approximate orientation of
the Marcellus and Utica Shale formations in Pennsylvania
and Ohio (King 2014).
more deeply. Shale is the targeted formation as it has a low permeability (King 2014). This low permeability coupled with the porosity of shale allows for natural gases derived from decayed organic material to become trapped in the pore space, within the rock (Energy.gov n.d). The issue is reaching the necessary depths to begin to mine the shale, which can be well over a mile under the surface (Figure 7). An exposure of Marcellus shale can be seen in Figure 8 as the black layer, a key indicator in the field of the formations presence. A number of methods exist to begin to mine the shale. The two methods include horizontal drilling and vertical drilling, though they differ because the horizontal drilling drills down vertically, then is curved at the end until it is horizontally situated. Vertical drilling does not curve the core at the end. Cement is then injected into the core in an attempt to better stabilize the surrounding area. Next, small explosives are detonated to crack the surrounding shale. The mined frac sand, called a proppant, is mixed with water and chemical additives and blasted through the detonated cracks. The well rounded shape of the sand grains and their overall strength allows them to prop open the fractures and allow the natural gas within to escape. The gas is then collected for use (EPA 2014). A large quantity of water is used in this process and is contained, generally on site, in waste water retention ponds.

Figure 8: This photograph shows an exposure of Marcellus Formation shale (the black layer) found in the Appalachian Basin (USGS NY). Estimates place the amount of accessible natural gas in the Marcellus Formation between 50-500 trillion cubic feet (PA DCNR).
     The video below is provided by the Oklahoma Energy Resources Board and is a very useful animation showing the process of hydraulic fracturing.


Conclusion
     The process of frac sand mining and hydraulic fracturing is indeed a very work intensive, resource intensive process. In many areas of the country this is a very polarizing issue. The debate as to whether or not this should go on examines more material than is feasible to discuss. On purpose, the intent of this blog was not to pick a faction to back, but rather to inform of the process and allow the reader to decide. One should find a number of informative sources under the "Useful Links" tab, located at the top of this page. The hope is that these sources will provide even more information about the process from credible sources, that assist the reader in forming their own opinion on the matter.


Works Cited 
  • Chase, T., & Golden, K. (2014, July 13). As rail moves frac sand across Wisconsin landscape, new conflicts emerge. Retrieved October 1, 2014.
  • EIA. (2011, May 9). Lower 48 States Shale Plays. Retrieved October 1, 2014, from http://www.eia.gov/oil_gas/rpd/shale_gas.pdf 
  • Energy.gov. (n.d.)What is Shale Gas? Retrieved October 1, 2014, from http://energy.gov/sites/prod/files/2013/04/f0/what_is_shale_gas.pdf
  • EPA. (2014, August 11). The Process of Hydraulic Fracturing. Retrieved October 1, 2014, from http://www2.epa.gov/hydraulicfracturing/process-hydraulic-fracturing
  • Frac sand: How is it mined? (n.d.). Retrieved October 1, 2014, from http://wgnhs.uwex.edu/wisconsin-geology/frac-sand-mining/frac-sand-mining-process/
  • King, H. (2014). Marcellus Shale - Appalachian Basin Natural Gas Play. Retrieved October 1, 2014, from http://geology.com/articles/marcellus-shale.shtml
  • Marcotty, J. (2012, January 3). Frac sand mining erupts in Winona County. Retrieved October 1, 2014, from http://www.startribune.com/local/blogs/136612183.html 
  • NY USGS. (n.d.). Marcellus Shale Image. Retrieved October 1, 2014, from http://ny.cf.er.usgs.gov/nyprojectsearch/projects/images/shalebig.jpg
  • PA DCNR. (2008). Marcellus Shale. Retrieved October 1, 2014, from http://www.dcnr.state.pa.us/topogeo/econresource/oilandgas/marcellus/marcellus_faq/marcellus_shale/index.htm
  • Parsen, M., & Zambito, J. (2014). Mining: Frac Sand. Retrieved October 1, 2014, from http://wgnhs.uwex.edu/wisconsin-geology/frac-sand-mining/ 
  • Phillis, M. (2013, July 28). Frac sand mining splits Wisconsin communities. Retrieved October 1, 2014. 
  • Prengaman, K. (2012, July 22). Wisconsin frac sand sites double. Retrieved October 1, 2014, from http://wisconsinwatch.org/2012/07/sand-sites-double/ 
  • Syverson, K. (2012, February 17). The Frac Sand Mining Boom in Wisconsin: Geology, Impacts, and Politics. Retrieved October 1, 2014, from http://www.uwec.edu/geology/index.htm 
  • WDNR. (2012). Silica Sand Mining in Wisconsin. Retrieved October 1, 2014. 
  • Well Frac Animation. (2011). Retrieved October 1, 2014, from http://www.oerb.com/Default.aspx?tabid=245